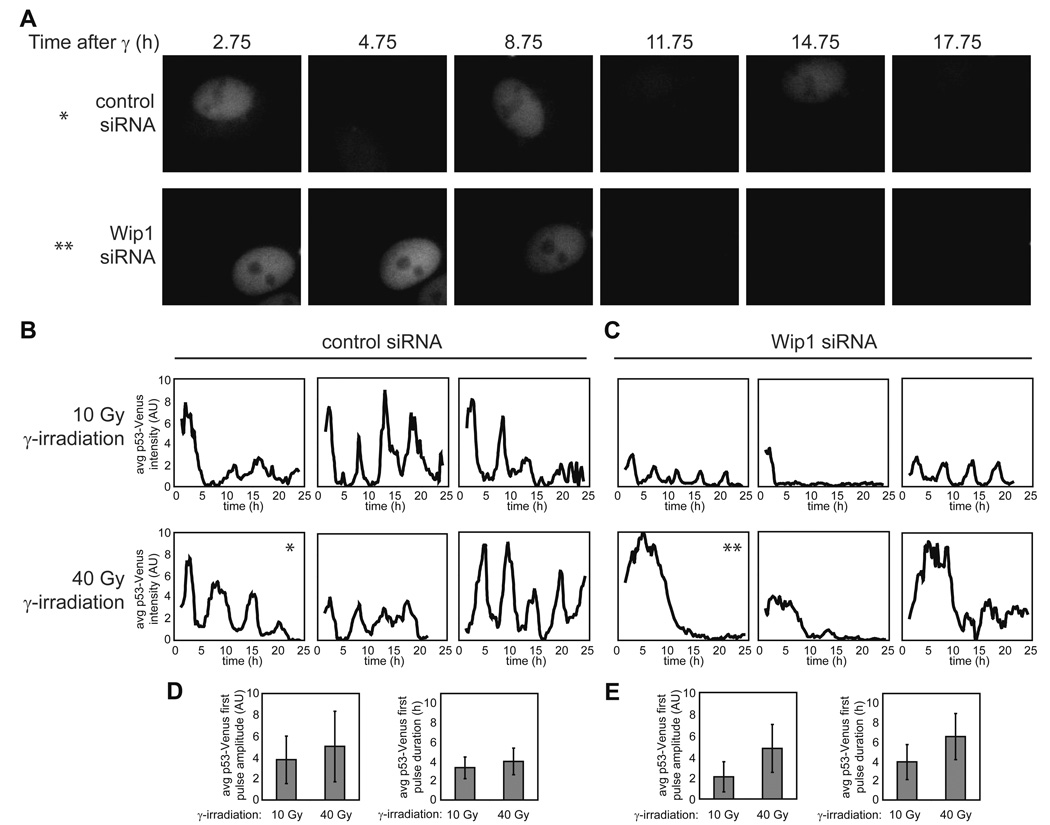
Figure 6. Wip1 RNAi treatment alters p53 dynamics.
(A) Images of clonal MCF7 cells expressing p53-Venus following 40 Gy of γ-irradiation. The upper panel shows an example of a cell treated with control siRNA. The lower panel shows an example of a cell treated with Wip1 siRNA. (B, C) Average nuclear p53 levels in representative clonal MCF7 cells expressing p53-Venus transfected with control siRNA (B) or Wip1 siRNA (C) irradiated with 10 Gy or 40 Gy of γ-irradiation. Asterisks indicate the correspondence between these plots and the images presented in (A). (D, E) Average amplitude and duration of the first pulse of p53-Venus for control cells (D) (10 Gy n = 84; 40 Gy n = 54) and Wip1 RNAi-treated cells (E) (10 Gy n = 62; 40 Gy n = 63). Bars = standard deviation.

