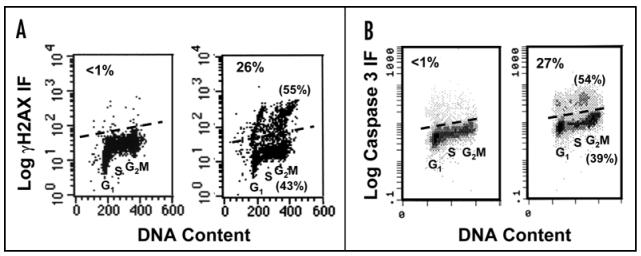
Figure 3.
Onset of apoptosis in TK6 cells. (A) High expression of γH2AX in a sub-population of cells treated with 100 µg/ml CPFX for 24 h (right panel) compared to controls (left panel). (B) Expression of activated caspase 3 in identically treated cells. Number in top left indicates % of apoptotic cells, and numbers in parentheses indicate % of nonapoptotic (lower) and apoptotic cells (upper) in G2 phase of the cell cycle

