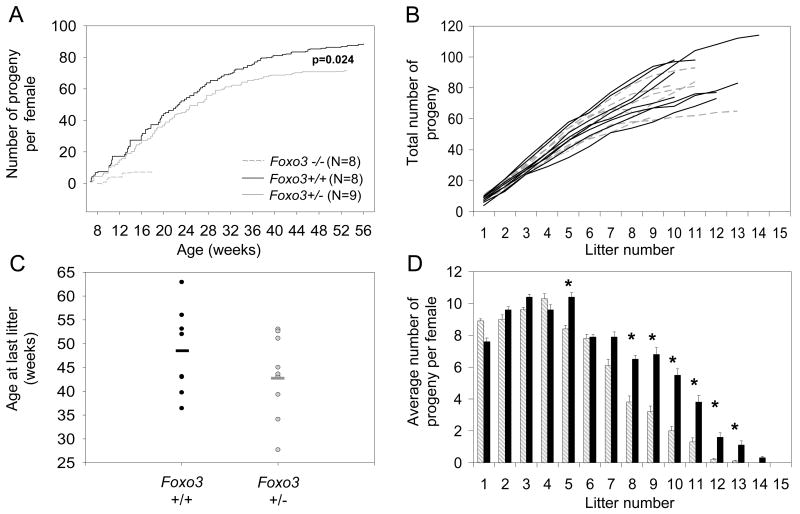
Figure 1.
Foxo3 haploinsufficiency in the mouse. For all panels, gray = Foxo3 heterozygotes, black = sibling wild-type controls. (A) Serial breeding assays showing average number of progeny per female as a function of maternal age. (B) Individual line plots of same data in panel A showing that differences are a genotypic class effect. (C) Onset of reproductive senescence as determined by maternal age at the time of last live birth. Solid bars represent the median. (D) Average number of progeny per genotypic class showing age-dependent decrease in fecundity in Foxo3−/+ female mice. Timepoints for which p<0.05 threshold (T-test) are marked with an asterisk.

