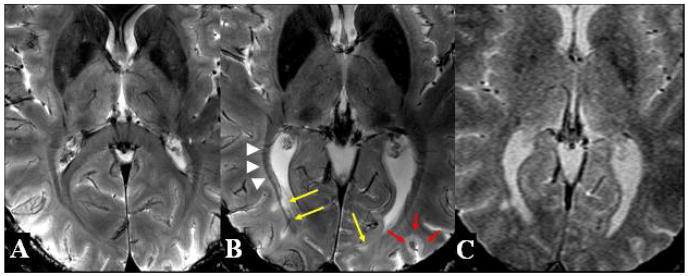
Figure 2. T2*-weighted images at the level of the basal ganglia on 7T MRI in Normal Control (A) and Patient 1 (B) as well as on 3T MRI in Patient 1 (C).
The lesions (yellow arrows) in close proximity to the optic radiations (white arrowheads), as depicted, seem to follow a perivenous distribution and not that of the dense white matter fiber tracts. Compared to normal control, there is marked increased iron deposition in the basal ganglia and thalamic areas (white arrows). Also shown is a cortical lesion originating from the cortical sulcus (red arrows). Furthermore, the perivenous relationship of lesions and cortical lesion is poorly demonstrated on 3T compared to 7T MRI with the similar sequence acquisitions.

