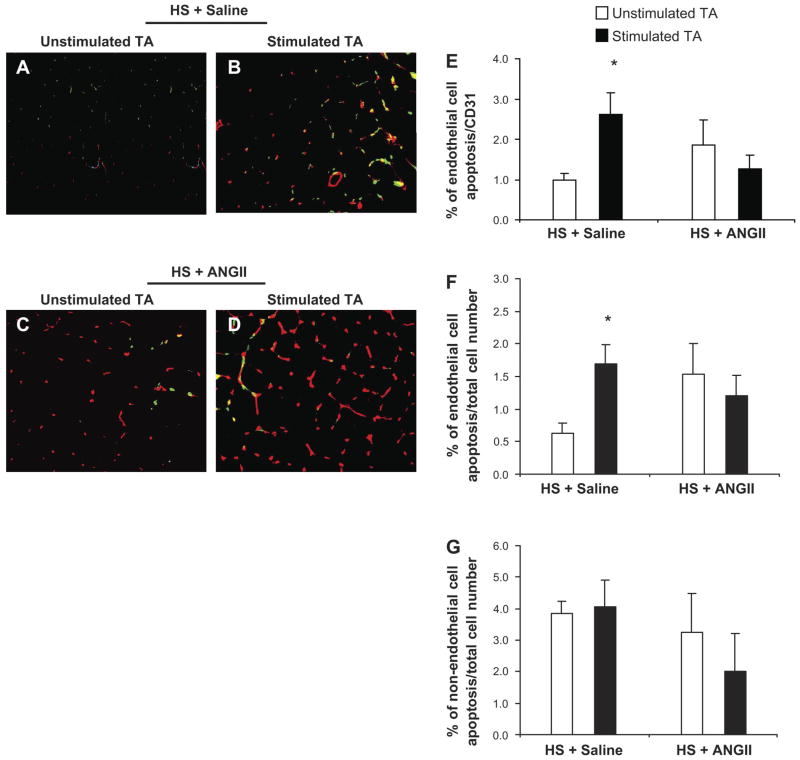
Fig. 5.
ANG II acts as a survival factor in skeletal muscle vascular ECs of SS-13BN fed a high salt diet. A–D: double immunofluorescent staining to detect apoptotic ECs in the TA muscle of SS-13BN rats fed a high-salt diet. A and B: representative images of unstimulated and stimulated TA of rats fed a high-salt diet and infused with saline, respectively. Red: ECs; green: apoptotic cells; yellow: apoptotic ECs. C and D: representative images of unstimulated and stimulated TA of rats fed a high-salt diet and infused with ANG II, respectively. E: percentage of EC apoptosis as a function of the total number of ECs. F: percentage of EC apoptosis as a function of the total number of cells. G: percentage of non-EC apoptosis as a function of the total number of cells. Values are expressed as means ± SE. *P < 0.05 vs. unstimulated TA; n = 9 in the HS + saline group and n = 6 in the HS + ANG II group. Values represent means ± SE. *P < 0.05 vs. unstimulated TA.

