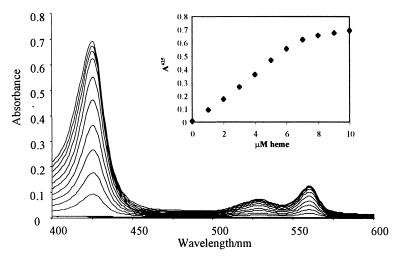
Figure 2.
Formation of reduced holo C11A/C14A cytochrome c552 from apo protein (9 μM) and heme, added in increments of 1 μM, as monitored by visible absorption spectroscopy immediately after mixing of the samples. No change was observed in the spectra after longer incubation. (Inset) The change in A425 with increasing amounts of heme.

