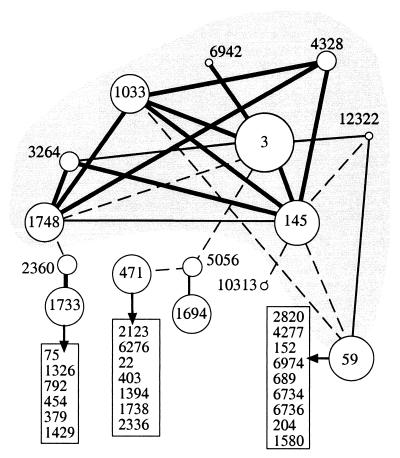
Figure 1.
A local graph of the globin family. A representation of the protomap graph surrounding cluster 3. The 15 clusters indicated by the circles account for 845 proteins, those that belong to globin family are within the gray area. The sizes of the circles are correlated with number of proteins (in increasing order 1–5, 5–50, 51–200, and >200 proteins in a cluster). Edges in the graph indicating the proximity between any two clusters as measured by the quality score. Quality score at e = 10-0 ranges from 0.99 to 0.01. Edges with quality >0.1, 0.06–0.1, and 0.01–0.05 are indicated by thick, thin, and dashed lines, respectively. All solved protein structures associated with the globin map (26 domains in cluster 3; 10 domains in cluster 145, and one domain in cluster 1748) belong to the globin fold. Clusters outside the gray area belong to unrelated sub graphs in terms of sequence and structure. See details in text.

