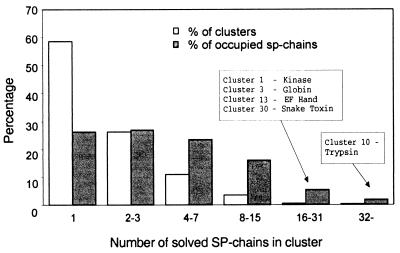
Figure 2.
Distribution of the number of solved SP-chains in each occupied cluster. Percent of occupied clusters with indicated number of solved SP-chains (empty bar) and the percent of solved SP-chains in each category (filled bar) is shown. The clusters with the largest number of solved SP-chains are indicated along with the cluster's signature.

