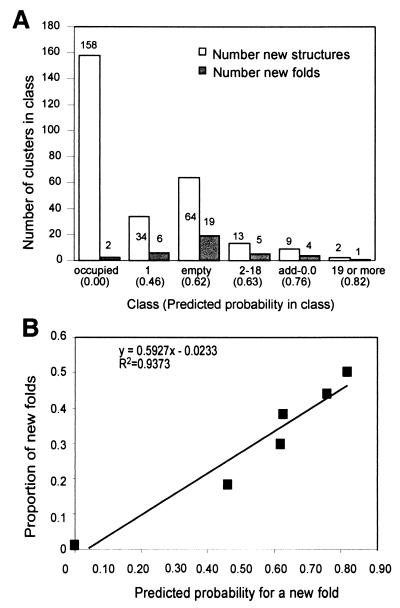
Figure 5.
Distribution of new structures from scop 1.39 records according to the probability classes. (A) Number of clusters in a class that were assigned with a new structure (open bar) and with a new fold (filled bar) from scop 1.39. (B) Proportion of new folds out of new structures that were assigned to any class as a function of the predicted probability to be new assigned to these classes. A linear trend line with its r-square value is shown.

