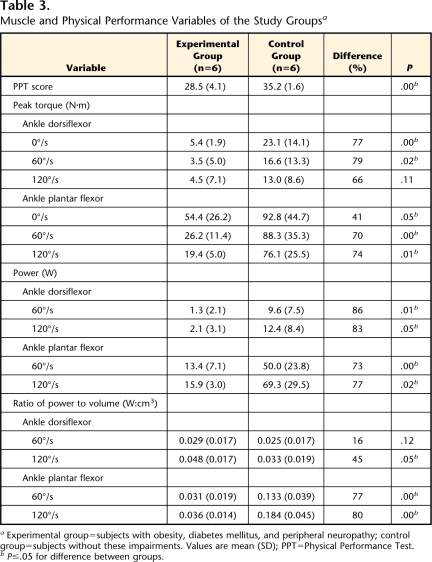
Table 3.
Muscle and Physical Performance Variables of the Study Groupsa
Experimental group=subjects with obesity, diabetes mellitus, and peripheral neuropathy; control group=subjects without these impairments. Values are mean (SD); PPT=Physical Performance Test.
bP≤.05 for difference between groups.

