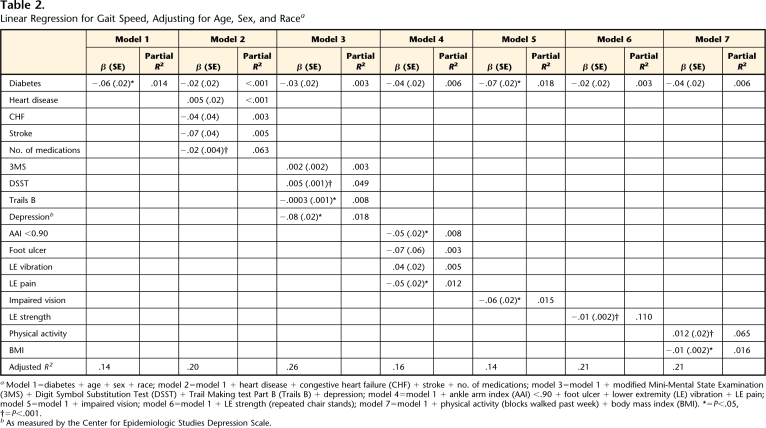
Table 2.
Linear Regression for Gait Speed, Adjusting for Age, Sex, and Racea
Model 1=diabetes + age + sex + race; model 2=model 1 + heart disease + congestive heart failure (CHF) + stroke + no. of medications; model 3=model 1 + modified Mini-Mental State Examination (3MS) + Digit Symbol Substitution Test (DSST) + Trail Making test Part B (Trails B) + depression; model 4=model 1 + ankle arm index (AAI) <.90 + foot ulcer + lower extremity (LE) vibration + LE pain; model 5=model 1 + impaired vision; model 6=model 1 + LE strength (repeated chair stands); model 7=model 1 + physical activity (blocks walked past week) + body mass index (BMI). *=P<.05, †=P<.001.
bAs measured by the Center for Epidemiologic Studies Depression Scale.

