
Fig. 4. Effect of overexpression of FL-Ec-gp96, Ec-gp96Δ200 and Ec-gp96ΔATP on the binding to and invasion of OmpA+ E. coli in HBMEC.
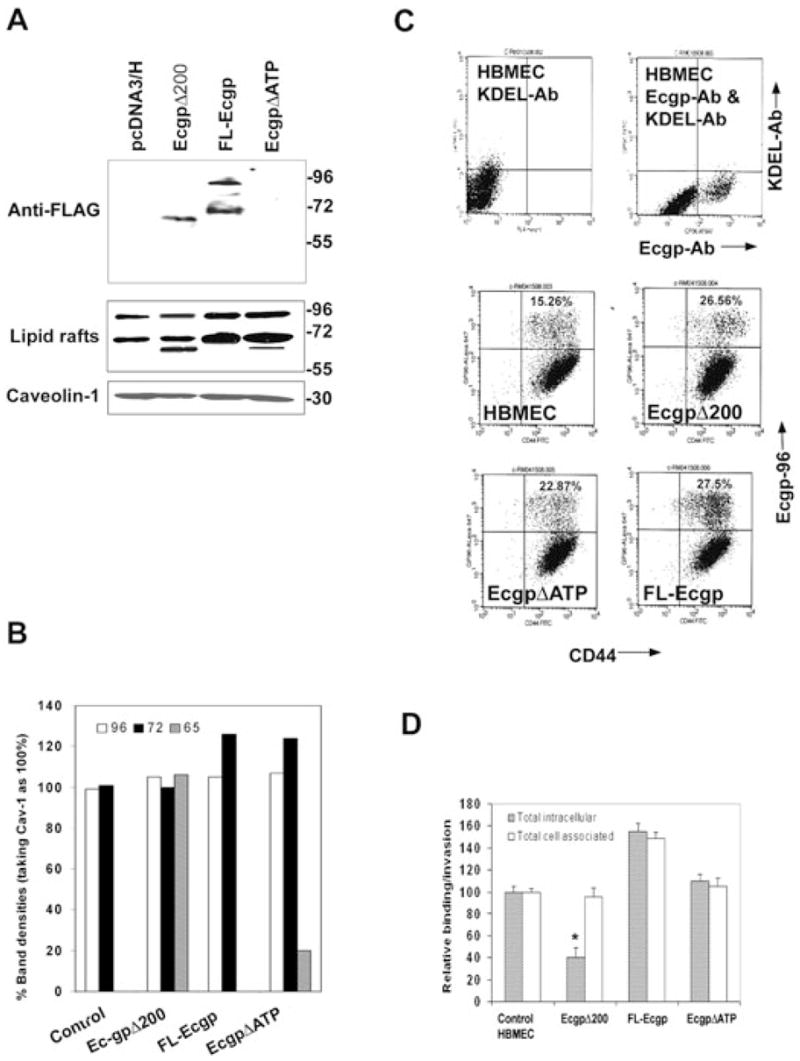
A. Total cell lysates of HBMEC expressing Ec-gp96Δ200, FL-Ec-gp96 and Ec-gp96ΔATP were prepared and examined by Western blotting using anti-FLAG antibody. Similarly, proteins from lipid raft fractions were subjected to Western blotting with anti-Ec-gp96 antibody. The amounts of protein loaded from lipid rafts were assessed by the presence of caveolin-1.
B. The densities of the protein bands in blots in Fig. 4A were determined, normalized to caveolin-1 and expressed as per cent densities being taken caveolin-1 levels as 100%.
C. HBMEC were subjected to flow cytometry after staining the cells with anti-Ec-gp96 antibody and with a monoclonal anti-gp96 antibody, which identifies a C-terminal portion of Ec-gp96 or monoclonal anti-KDEL antibody, which interacts with the KDEL region of Ec-gp96. In separate experiments, HBMEC overexpressing FL-Ec-gp96, Ec-gp96Δ200 and Ec-gp96ΔATP were subjected to flow cytometry after labelled with anti-Ec-gp96 and anti-CD44 antibodies followed by secondary antibodies coupled to Alexa 488 and 647. D. HBMEC expressing plasmid alone (control), FL-Ec-gp96, Ec-gp96Δ200 or Ec-gp96ΔATP were subjected to FACS, the Ec-gp96-positive populations were plated in 24-well culture dishes until they reach confluence and used for binding and invasion assays with OmpA+ E. coli as described in Methods. The data represent mean ± SD from three different experiments carried out in triplicate and expressed as relative binding/invasion being taken OmpA+ E. coli parameters in control HBMEC as 100%.