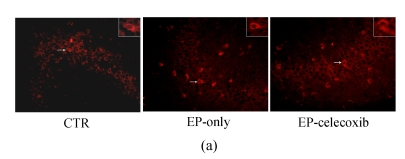
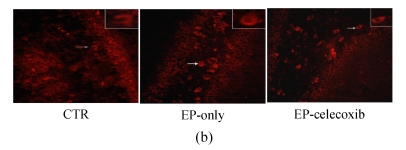
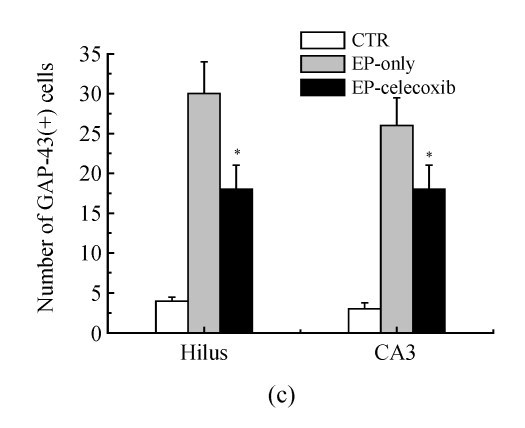
Fig. 4.
Fluorescent immunohistochemical analysis of GAP-43-positive activated microglia (arrows shown). GAP-43-positive activated microglia in the (a) CA3 and (b) hilus at 14 d after SE. The number of GAP-43-positive cells was reduced by celecoxib treatment; (c) Quantitative analysis showed that the numbers of GAP-43-positive cells were reduced by 40% in the hilus and by 35% in the CA3. Bars represent mean±SD; * P<0.05 compared with the epilepsy-only group (n=8, t-test)


