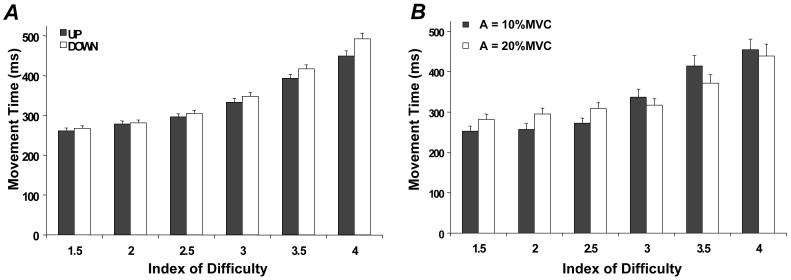
Figure 4.
Average movement time for different ID levels (across all subjects with standard error bars). A: MTUP (solid bars) and MTDN (white bars) both increase as ID level increases, B: The Amplitude × ID interaction for IMR and IRML tasks is shown. For IDs less than or equal to 2.5, MT (the average of MTUP and MTDN) was smaller for the smaller force production amplitude (A10, solid bars). For IDs larger than or equal to 3.0, MT was smaller for the larger force production amplitude (A20, white bars).

