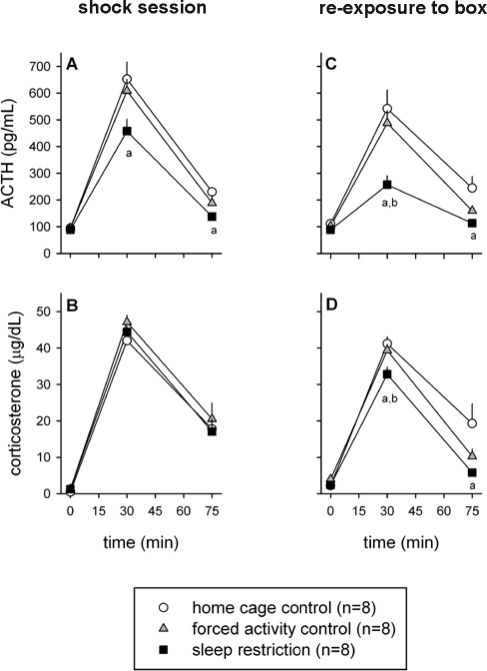
Figure 2.
Effect of sleep restriction on the HPA axis response to stress. Sleep restricted and control rats were exposed to a 30-min session of footshocks after 7 d (left panels, A and B) and a 30-min reexposure to the shock box on day 8 (right panels, C and D). Significant differences in ACTH and CORT responses between sleep restricted and control animals: a = P < 0.05 compared to home cage control, b = P < 0.05 compared to forced activity control. All data are expressed as averages ± SEM.

