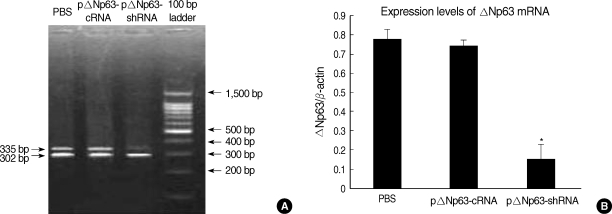
Fig. 1.
The mRNA expression of ΔNp63 in 5637 cells 48 hr post-transfection, assayed by semiquantitative RT-PCR. (A) Products were analyzed on a 1.5% agarose gel. The 335 bp band is ΔNp63 mRNA. The 302 bp band is β-actin serving as the internal control. (B) Quantified expression levels of ΔNp63 as normalized to the β-actin level. *Statistically significant (p<0.05, mean±SD, n=10) relative to control shRNA.

