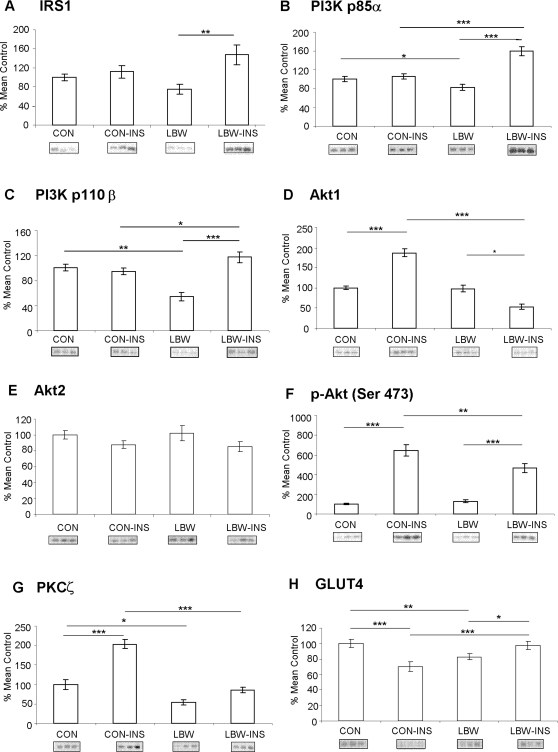
Figure 1. Expression and phosphorylation of key proteins involved in PI3K signalling.
Bars represent mean basal and insulin-stimulated (INS) expression values±SEM for low birth weight (LBW) and control (CON) individuals, expressed as % of mean control. Representative blots of the respective proteins are located below the corresponding bar graphs. *p<0.05, **p<0.01, ***p<0.001.

