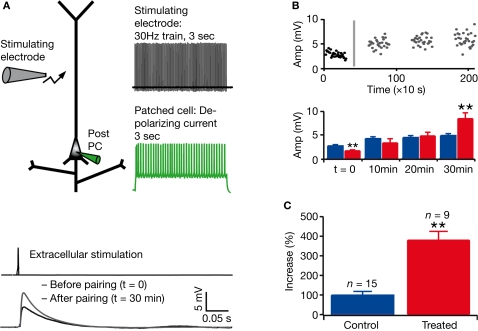
Figure 4.
Enhanced long-term potentiation in layer 5 pyramidal neurons. (A) Experimental scheme and pairing protocol; example of mean response in a patched cell, before and after pairing. (B) Example of response amplitude as a function of time (the grey line represents the timing of the pairing protocol); mean absolute values for control (blue) and treated (red) rats before pairing (t = 0) and at three different times after pairing. (C) Mean of percentage increase in the amplitude of the response to extracellular stimulation 30 min after pairing. Data show mean ± SEM (**P < 0.01).

