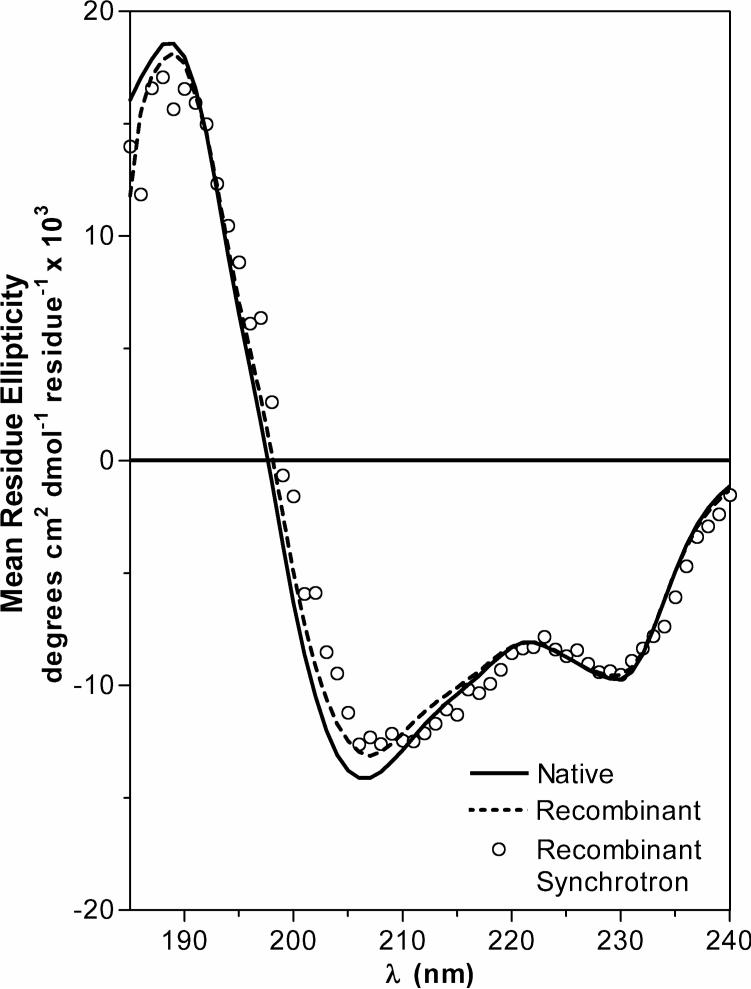
Figure 1.
Structural comparison between natural and recombinant MSlyz. Data for natural and recombinant enzyme collected on a Jasco 810 spectropolarimeter are drawn with solid and dotted lines. Recombinant MSlyz ellipticities were collected at U9B NSLS Brookhaven synchrotron are represented with circles. Inset graph represents the near-UV circular dichroism spectra.

