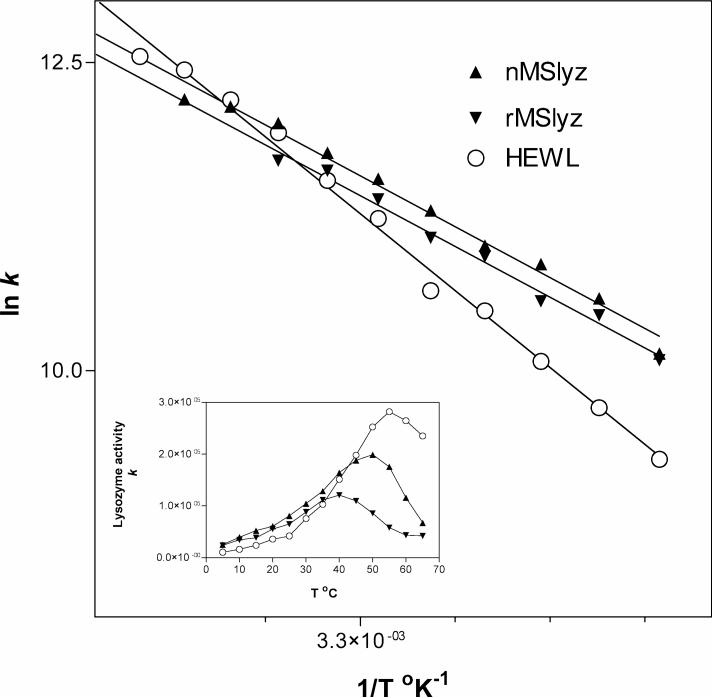
Figure 2.
Arrhenius plot for temperature dependence of lysozyme activity. Natural (nMSlyz) and recombinant (rMSlyz) data are compared with hen egg white lysozyme (HEWL) as a reference. Inset graph represents raw experimental data on arbitrary units. Lysozyme activity k is described in Materials and Methods.

