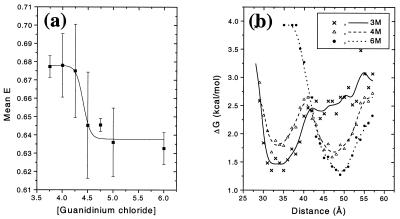
Figure 3.
(a) Shift in the mean E of the denatured subpopulation for pwt CI2. The error bars are single SDs. The solid line is a guide to the eye. (b) Potentials V(R) (free energy functions) for pwt CI2 at 3, 4, and 6 M denaturant. The solid lines represent a smoothing of the data and are meant as a guide to the eye.

