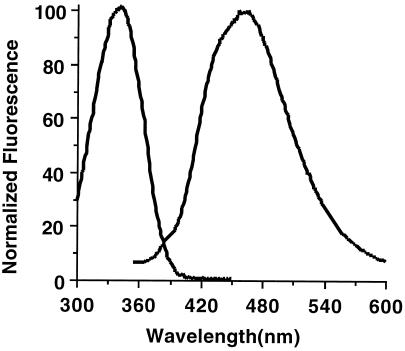
Figure 1.
NAD(P)H excitation and emission spectra. Purified NADH and NADPH were suspended to 1 μM concentration in 50 mM Na2HPO4/50 mM sodium acetate/50 mM glycine, pH 7.0. The excitation spectrum was obtained by exciting at wavelengths from 300 nm to 460 nm while detecting emission at 465 nm. The emission spectrum was obtained by exciting 340 nm and scanning the emission wavelength from 350 nm to 600 nm. NADPH spectra exactly overlay NADH spectra.

