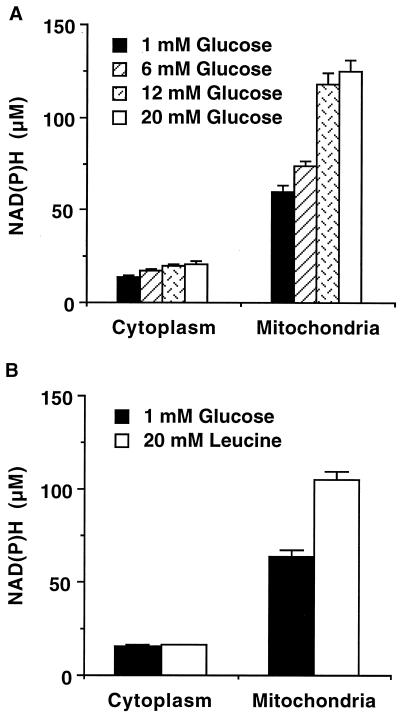
Figure 4.
Spatial separation of the NAD(P)H response. Flattened pancreatic islets were imaged at 100 pixels/μm2 in the presence of glucose (A) or leucine (B). The NAD(P)H fluorescence signals were quantified from an NADH standard curve. (A) The fluorescence signals for the cytoplasm and the mitochondria were determined in the presence of increasing levels of glucose. Data are represented by the mean ± standard error (n = 90 to 150 regions of interest from 3–9 islets) (B) The fluorescence signals for the cytoplasm and the mitochondria were determined in the presence of 1 mM glucose and 20 mM leucine. Data are represented by the mean ± standard error (n = 50 regions of interest from 5 islets).

