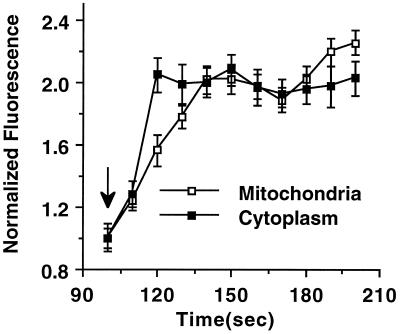
Figure 5.
Temporal separation of the NAD(P)H response. The mitochondrial and cytoplasmic NAD(P)H signals were measured in flattened pancreatic islets at 10-sec intervals for 100 sec at 1 mM glucose before the addition of a bolus of 20 mM glucose (denoted by the arrow). The islets were monitored for an additional 500 sec. Only the 100- to 200-sec time segment is shown here. Data are represented by the mean ± standard error (n = 40 regions of interest from 4 islets).

