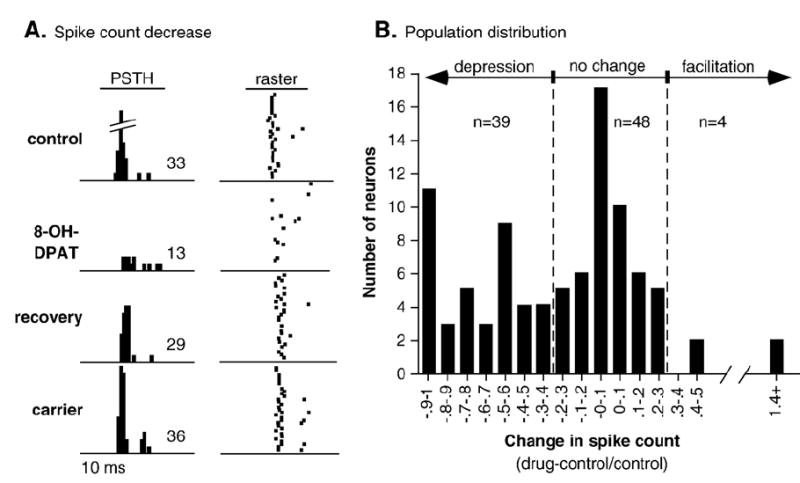
Fig. 1.

Effects of 8-OH-DPAT iontophoresis on neural responses. (A) Paired PSTHs and raster plots of the response of a single neuron to a 30-dB SPL, 10-kHz FM sweep centered at 25 kHz. Spikes are plotted in the control, in response to iontophoresis of 8-OH-DPAT, during the recovery, and in response to the carrier used to dissolve 8-OH-DPAT, 200 mM NaCl. The 10-ms stimulus is too far in advance of the spikes to plot; the average spike latency is 17.1 ms after stimulus onset for the control. Numbers in each PSTH are spike counts. 8-OH-DPAT depressed spikes, but the carrier did not. (B) Distribution of changes in response during the iontophoresis of the 5-HT1A agonist 8-OH-DPAT. Values along the x-axis are normalized changes in evoked spike count ((drug–control)/control), so that negative values indicate depressions in spike count and positive values indicate facilitations in spike count. Gray dashed lines mark 30% facilitation and depression in response, respectively; sample sizes are for neurons within categories determined by this criterion.
