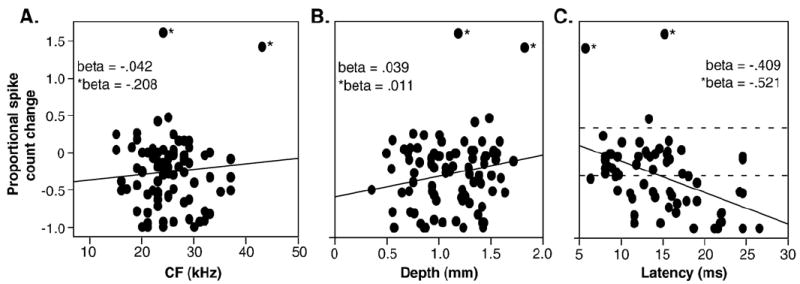
Fig. 2.

Comparison of 8-OH-DPAT-evoked changes in response with the CFs (A), recording depths (B), and control first-spike latencies (C) of all neurons. Lines represent linear fits to the data. Asterisks mark two outlier neurons. Beta values are for all neurons shown (beta) or excluding the two outliers (*beta). The only significant regression is with latency (see text). Dashed lines mark depressions and facilitations of responses by 30%, as depicted in Fig. 1.
