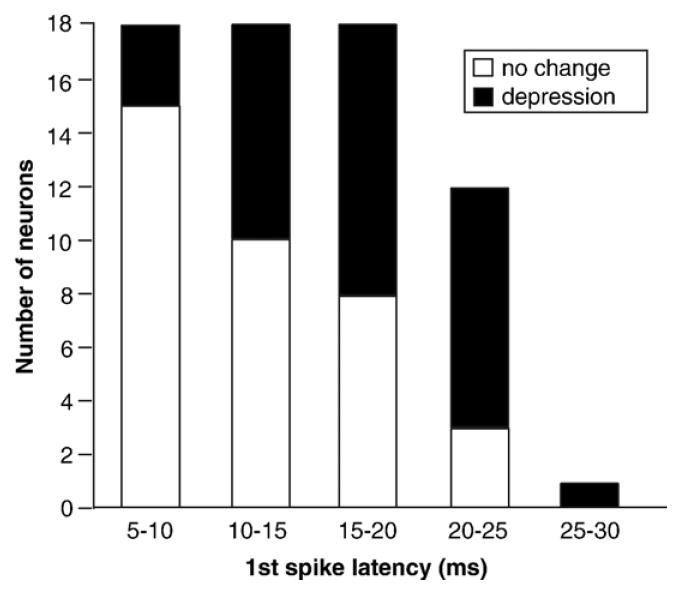
Fig. 3.

Latency distributions of neurons with no 8-OH-DPAT-evoked changes in response (open bars) versus depressions in response (filled bars). Stacked categories of no change versus depression are relative to a 30% change in response from the control.
