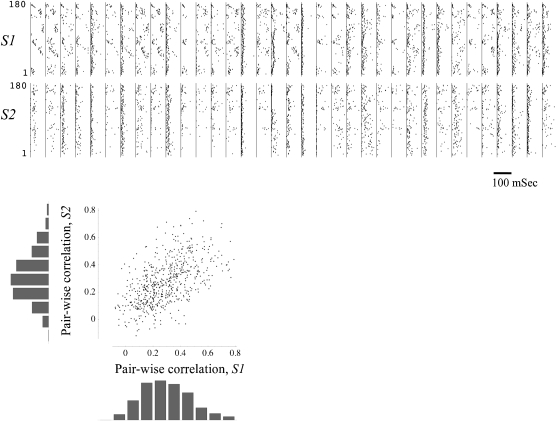
Figure 1. Latencies to first downstream spikes.
Thirty-five columns are shown in the upper part of the figure, representing responses of 35 neurons (spike-sorted units) to two series of 180 stimuli that were applied at a rate of 0.2 Sec−1 each, first from one stimulation site (S1, top row) and then from another (S2, bottom row). In each column a vertical line depicts 10 mSec following stimulus time (see text), and a series of points represent the latencies to first spikes detected thereon in response to consecutive stimuli. Latencies greater then 100 mSec are not plotted (see scale bar). Bottom panel: Pair-wise correlation distributions for each of the two stimulation sources (bar charts). Each of the points in the main graph depicts the correlation between first spike latencies of a given pair of neurons, computed from responses to S1 (X axis) and S2 (Y axis); there are 595 points in the graph, representing all possible neuronal pairs.

