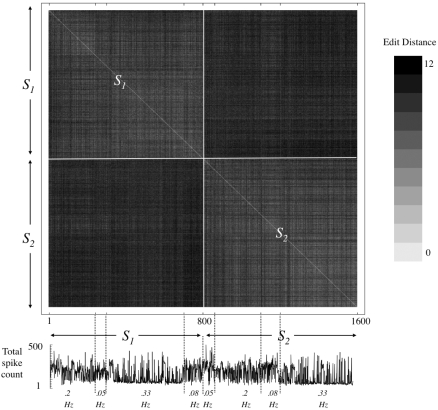
Figure 6. Order-based representation.
Bottom trace: Stimuli were applied intermittently from the two sites, at four different frequency regimens (f, Sec−1): fS1 = 0.2, fS2 = 0.05; fS1 = 0.05, fS2 = 0.2; fS1 = 0.33, fS2 = 0.08; and fS1 = 0.08, fS2 = 0.33. The total number of spikes detected in all the electrodes within 500 mSec following each of the 1600 stimuli is sorted according to stimulus site (S1 and S2), the order in which stimuli were applied, and the frequency of stimulation. Note that the four different frequency regimens yielded very different spike counts. Upper panel: A matrix of Edit Distances between first spike recruitment orders evoked in response to the repeated stimuli applied from the two stimulation sites. The matrix is temporally aligned to the bottom panel. Distances are computed using the Levenshtein Edit Distance. Clusters of similarity that match the two sources (S1 and S2) are clearly observed (depicted).

