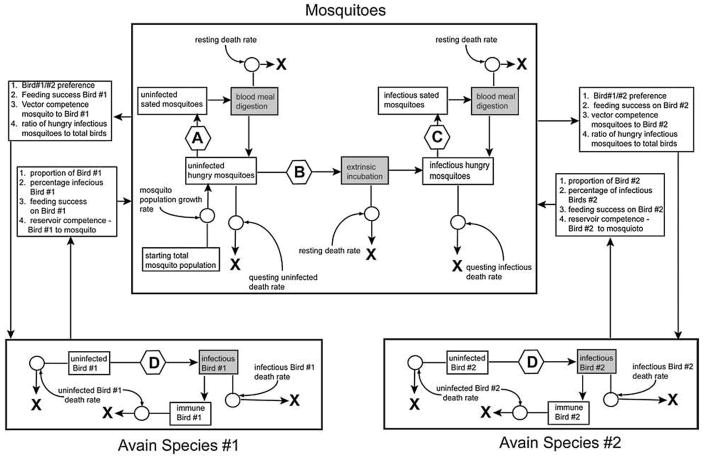
FIG. 3.
Schematic of model used to compare reservoir capacities of different avian species. Large boxes highlight the avian and mosquito modules that make up the model. Variables that affect the interaction of the three modules are listed in small boxes interrupting the arrows that connect the modules. The arrows connecting the modules indicate the direction of the interactions among the modules. Within each module, the white boxes indicate stocks of the avian reservoir and vector mosquito species in different states (e.g., uninfected or infectious). Gray boxes indicate conveyors, in which animals moving from one stock to another must rest for a defined period of time before moving to the next stock. The bold Xs indicate death of animals in a given stock, resulting in removal from subsequent iterations of the model. Arrows indicate the direction that animals may move from stock to stock. Arrows interrupted by a circle indicate that movement from one stock to another stock is governed by a single variable. This variable is indicated by the curved arrow pointed to the circle in question. Arrows interrupted by hexagons symbolize that movement between the stocks indicated is controlled by multiple variables, most of which affect the interactions between the modules. Variables affecting the transitions in each hexagon are as follows. Hexagon A: Number of uninfected birds of species 1 (susceptible and immune), number of uninfected birds of species 2 (susceptible and immune), and relative feeding upon species 1 and species 2, calculated from the relative feeding indices of the two species. Hexagon B: Number of infectious birds of species 1, number of infectious birds of species 2 and relative feeding upon species 1 and species 2. Hexagon C: Total number of birds of species 1, total number of birds of species 2, and relative feeding upon species 1 and species 2. Hexagon D: Number of infectious mosquitoes, number of susceptible birds, and relative feeding preference on species 1 and species 2.

