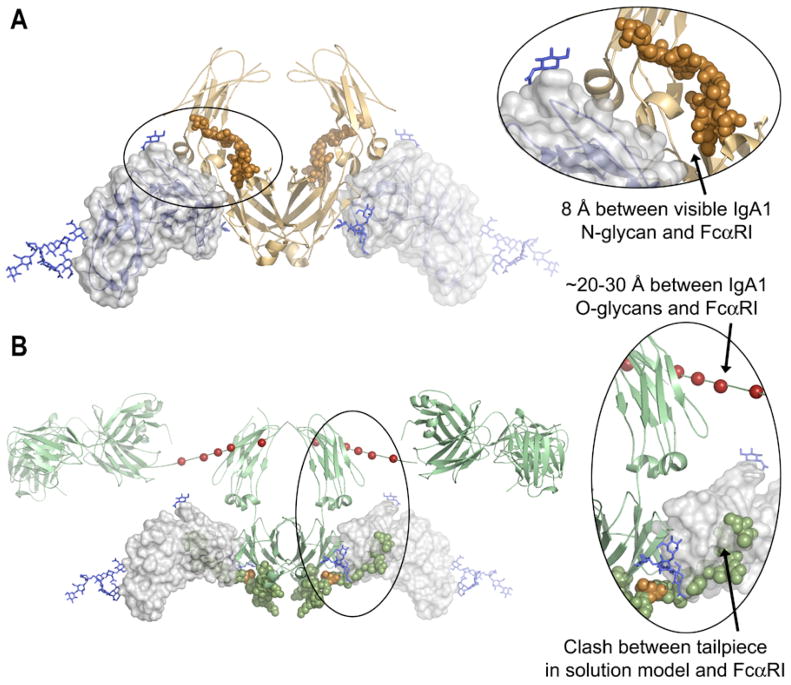
Figure 1. Structural views of the IgA1 N-glycans and tailpiece.
(A) Crystal structure of the FcαRI:Fcα complex (pdb 1OW0, reference (9), showing that the CH2 N-glycan on IgA1 (copper spheres) approaches FcαRI (blue ribbons and transparent surface) but does not directly contact the receptor. The electron density for the N-glycan was weak and only one branch of the complex carbohydrate was visible.
(B) Docking of FcαRI from the FcαRI:Fcα complex onto the low-resolution solution scattering structure of intact IgA1 (pdb 1IGA, reference (14). The deposited IgA1 model illustrates one possible location for the IgA1 tailpiece, which is shown as green spheres, with N459 (the location of the tailpiece N-glycan) in gold. Note that in this potential orientation the tailpiece clashes with FcαRI, and that the potential hinge O-glycosylation sites (red spheres) are distant from FcαRI.

