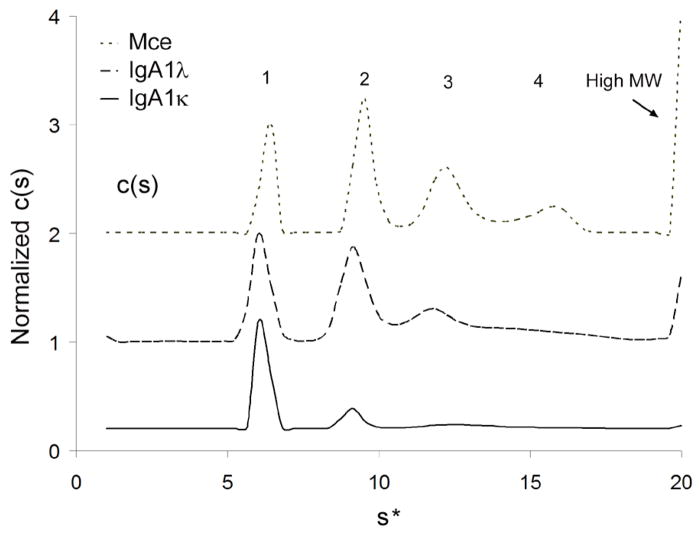
Figure 2. Sedimentation Velocity Analysis of IgA1 κ, λ and Mce.
IgA1 κ, λ and Mce samples were spun at 36,000 rpm in a Beckman XL-I analytical ultracentrifuge. Data were fitted using the c(s) and c(M) sedimentation analysis routines in the program SEDFIT, which yielded the differential distribution coefficients of the sedimenting species for each sample. Distinct peaks corresponding to monomeric (labeled “1”), dimeric (“2”), trimeric (“3”) and polymeric (“4”) IgA1 species could be resolved from high molecular weight aggregates in all three samples analyzed.

