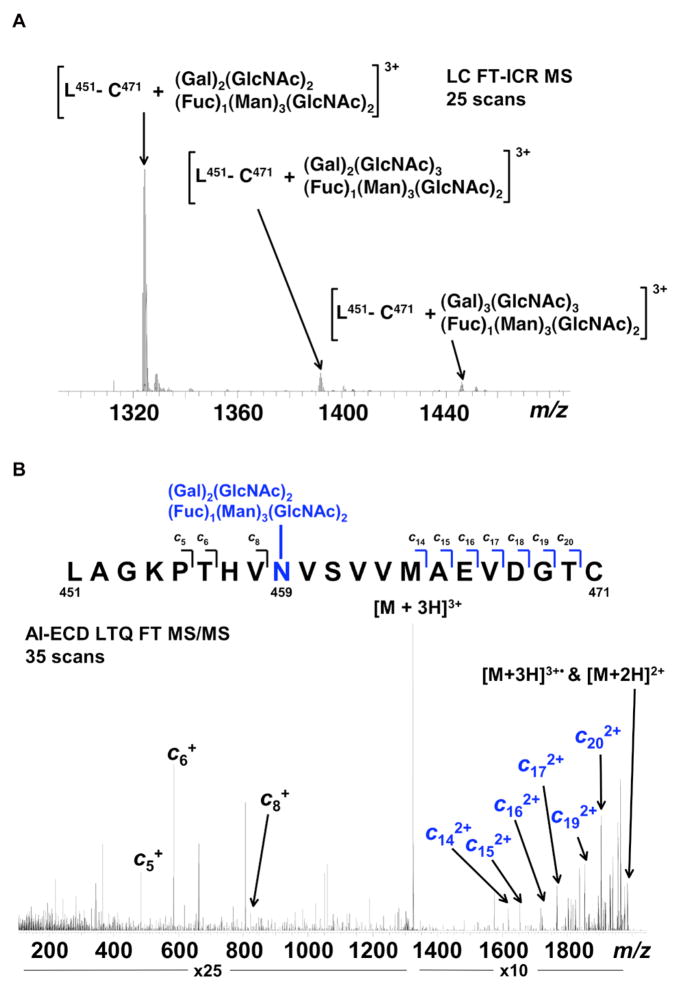
Figure 5. Representative FT-ICR data for mIgA1κ N-glycans.
(A) FT-ICR MS spectrum from the average of 25 LC FT-ICR MS scans revealing the presence of three distinct mIgA1κ N-glycopeptides. Each N-glycopeptide corresponds to the mass of the IgA1 peptide L451-C471 with three related but distinct glycans. (B) AI-ECD FT-ICR tandem mass spectrum of the [L451-C471 + (Gal)2(GlcNAc)2(Fuc)1(Man)3(GlcNAc)2]3+ triply charged ion species confirms the peptide sequence as the tailpiece (N459) site of mIgA1κ. A total of ten c type fragments were observed, originating from the N-terminus. Seven fragments C-terminal to N459 correspond to the mass of the IgA1 tryptic peptide plus the mass of the attached glycan, in contrast to the three fragments N-terminal to N459. The mass accuracy of the three IgA1 tailpiece N -glycans shown in (A) are as follows: L451-C471 + (Gal)2(GlcNAc)2(Fuc)1(Man)3(GlcNAc)2—theoretical mass 3968.714, measured mass 3968.724, error 2.52 ppm; L451-C471 + (Gal)2(GlcNAc)3(Fuc)1(Man)3(GlcNAc)2—theoretical mass 4171.793, measured mass 4171.806, error 3.24 ppm; L451-C471 + (Gal)3(GlcNAc)3(Fuc)1(Man)3(GlcNAc)2—theoretical mass 4333.846, measured mass 4333.848, error 0.67 ppm. Table 5 lists the identified IgA1 N-glycans identified for both mIgA1κ and mIgA1λ.

