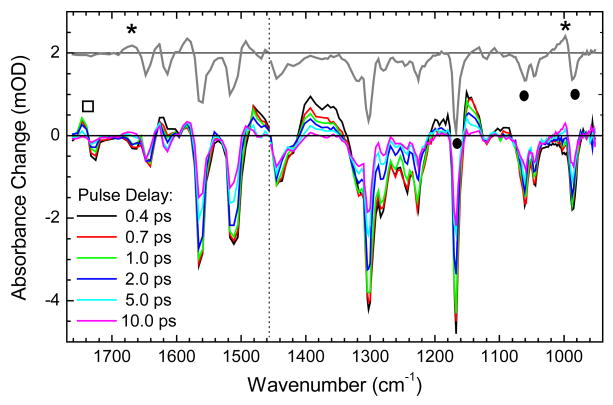
Figure 3.
Transient absorbance difference spectra of PYP measured at different pulse delays under polarization anisotropy free conditions, showing initial bleaching of vibrational bands of the dark P state, and the overlapping transient absorbance bands of the excited P*, the “hot” recovered P state and the product I0 state at early delays. The grey curve, indicating the averaged transient absorbance measured from 20 to 300 ps, consists of (negative) bleach signals in the ground P state and positive absorbance signals of the I0 product state. This curve has been displaced 2 mOD units for clarity purposes. The vibrational marker modes are depicted as solid dots (P state) and as asterisks (I0 state), while the location of νC=O of Glu46 is shown as open square.

