Figure 1.
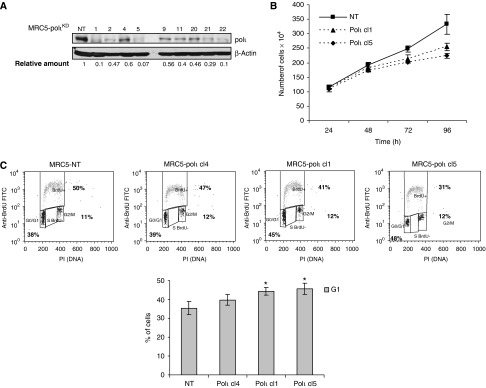
Characterisation of cell lines stably downregulating polι (MRC5-polιKD). (A) Western blotting analysis of MRC5-polιKD clones (numbered above). Relative amount was calculated as a ratio of polι/NT after normalisation with β-actin amount. (B) Growth kinetics over 4 days of two MRC5-polιKD clones (nos. 1 and 5) and control cells (MRC5-NT). (C) Cell cycle analysis of MRC5-polιKD and MRC5-NT cell lines. The top panel shows a representative cell cycle distribution of the indicated cell line as measured by BrdU incorporation in flow cytometric analysis. The percentage of cells in all phases (G1/S/G2–M) is indicated. In the bottom panel, the histograms report the percentages of cells in G1 phase. The reported values are the means±s.d. of nine independent experiments (*P<0.05).

