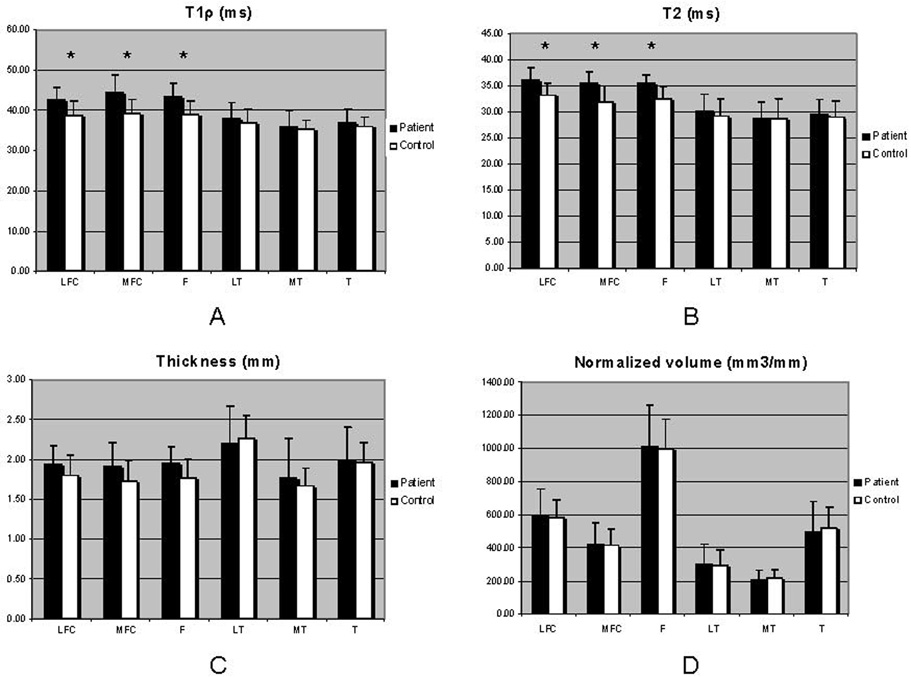
Figure 5.
Articular cartilage data: T1ρ and T2 relaxation times as well as thickness and normalized volume were computed in OA patients compared with controls, using the ANOVA F-test; to account for the variation in joint size, the calculated volume was normalized to the epicondylar distance of each respective subject; the epicondylar distance was used to standardize the volume due to its invariance to osteoarthritic changes; *P<0.05.

