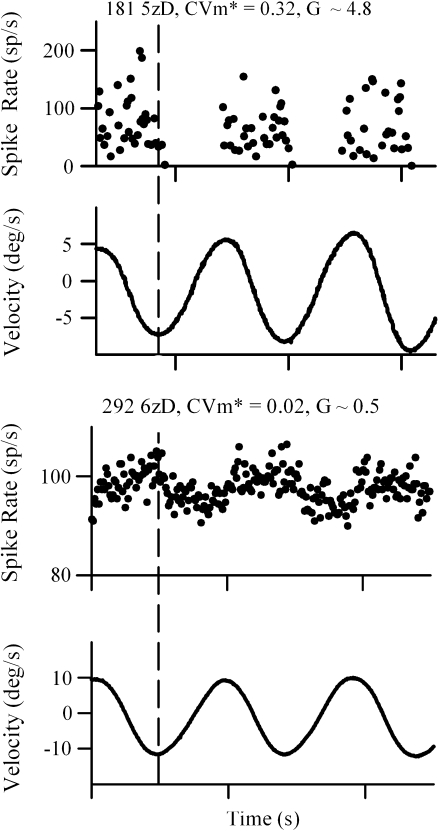
FIG. 2.
Two examples of the discharge response obtained from vestibular primary afferents innervating the left horizontal crista in the present study. Cells shown were activated by counter-clockwise rotation. The figure illustrates the wide range of sensitivities evidenced by cells responding to rotation. Discharge rate (sp/s) was calculated as the reciprocal of the inter-spike interval based on the onset time of each spike discharge minus the onset time of the preceding spike. Gain (G) was calculated as the mean peak-to-peak discharge rate divided by the peak-to-peak angular velocity. For stimulus plots, positive fluctuations (upward) indicate clockwise rotation, whereas negative fluctuations (downward) reflect counter-clockwise rotation. Angular velocity is represented in degrees per second. The stimulus frequencies shown were approximately one cycle per second.

