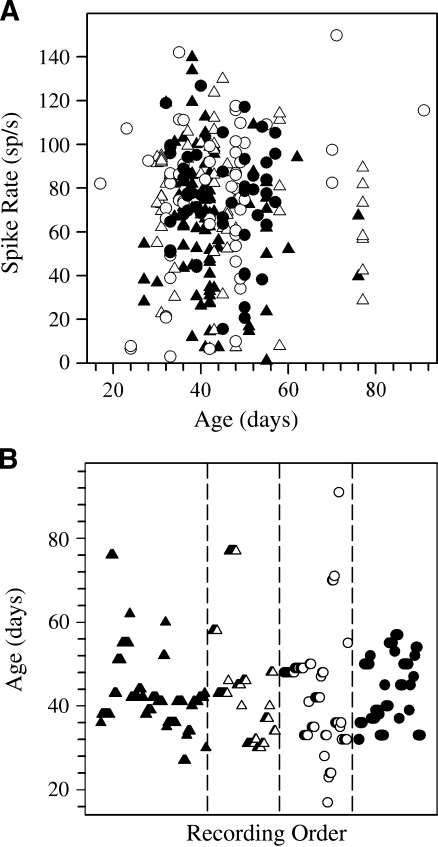
FIG. 4.
Summary of mean spontaneous discharge rates (sp/s) and ages. A Summary of the mean discharge rate versus animal age. B Distribution of animal ages (days) among the four genotypes of the present study. For each genotype, the ages of cells are plotted according to the order in which they were recorded (recording order). Filled triangle het(+/−), open triangle het(−/−), open circle tlt(−/−), filled circle tlt(+/−).

