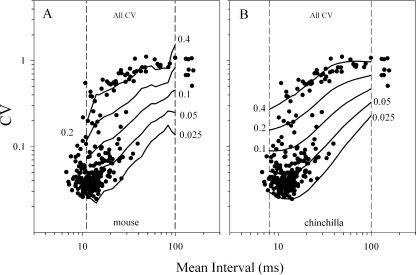
FIG. 7.
Interval coefficient of variation (CV) for all cells plotted as a function of discharge interval [i.e., inter-spike interval (ISI)]. The graphs illustrate the CV–ISI distribution for all cells. The solid line curves represent the power functions given by CV = a(t)(CV*)b(t) where a(t) and b(t) are the coefficients determined by Lasker et. al. (2008) for the mouse (A CVm*) and by Baird et al. (1988) for the chinchilla (B CVc*). A CV are superposed with normalized iso-lines for CVm* (mouse) where CV = a(t)(CVm*)b(t). Iso-lines represent CVm* values of 0.025, 0.05, 0.1, 0.2, and 0.4. B CV are superposed with normalized iso-lines for CVc* (chinchilla) where CV = a(t)(CVc*)b(t). Lines for CVc* values of 0.025, 0.05, 0.1, 0.2, and 0.4 are shown. Vertical dashed lines mark the limiting range of discharge intervals available for the mouse (A) and chinchilla (B). CV values lying outside interval ranges could not be normalized. Coefficients available for the chinchilla (B) afforded the maximum number of normalized CV.

