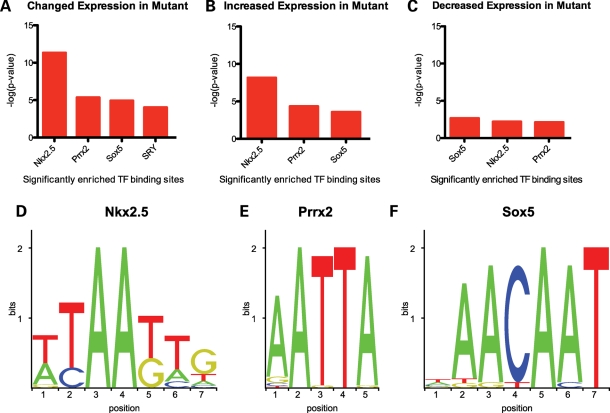
Figure 7.
(A) JASPAR TFBSs significantly enriched in the region −5000 bp upstream of the TSS of all differentially expressed genes relative to those regions upstream of all genes present in at least four of the eight arrays where P < 0.01 and Z-score >10. (B) TFBSs significantly enriched in the regions −5000 bp upstream of the TSS of genes whose expression increased within the subpallium in the absence of Arx. (C) TFBSs significantly enriched in the regions −5000 bp upstream of the TSS of genes whose expression decreased within the subpallium in the absence of Arx. Weblogos of the position weight matrices corresponding to the JASPAR (D) Nkx2.5, (E) Prrx2 and (F) Sox5 binding sites found to be enriched.

