Figure 2.
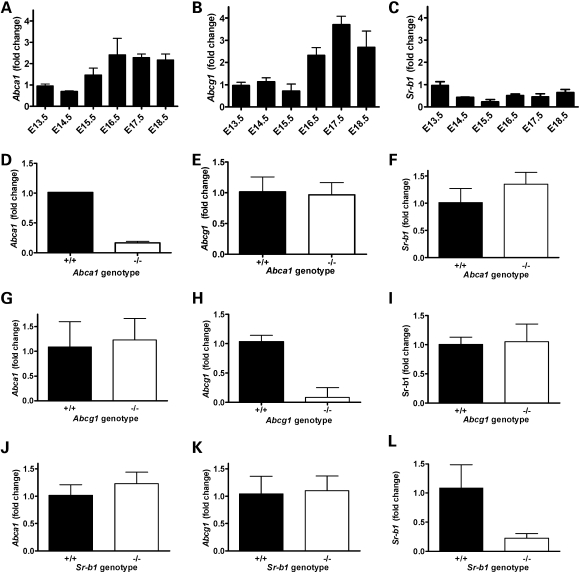
Abca1, Abcg1 and Sr-b1 expression in placental tissue. Fold change of mRNA expression in mouse placentas. Expression of Abca1 (A), Abcg1 (B) and Sr-b1 (C) during gestation from E13.5 to E18.5. n = 4 from same litter for each time point. Data are normalized to E13.5 expression levels. The average CT- values for E13.5 placenta were 25.7, 24.1 and 24.2 for Abca1, Abcg1 and Sr-b1, respectively. Expression of Abca1, Abcg1 and Sr-b1 in placentas from Abca1+/+ and Abca1−/− fetuses, n = 2 and 4 (D–F); from Abcg1+/+ and Abcg1−/− fetuses, n = 7 and 6 (G–I) and from Sr-b1+/+ and Sr-b1−/− mutants, n = 7 and 5 (J–L). Values are fold change compared with mean of +/+.

