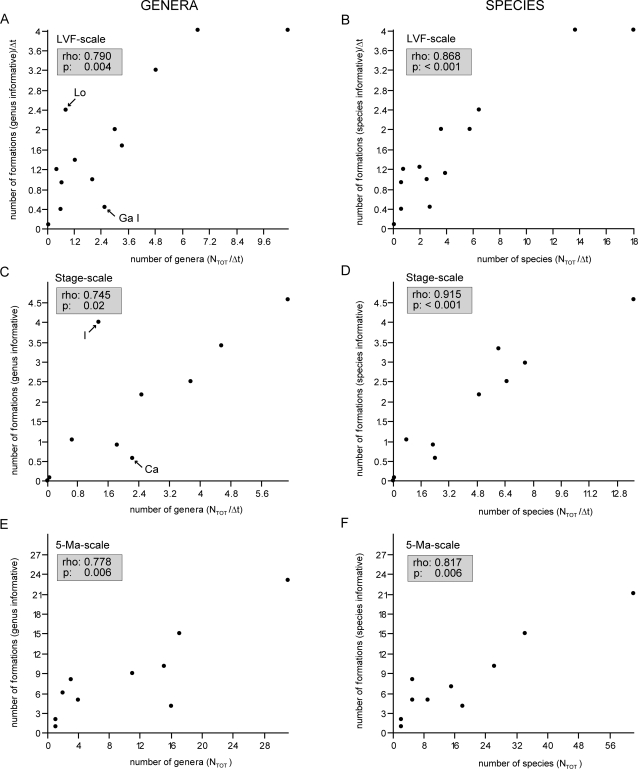
Figure 4. Correlation of anomodont diversity and the rock record at various scales.
Graphs plotting the number of genera (a, c, e) and species (b, d, f) against the number of informative formations. a–b) Total richness (Ntot/Δt) at the LVF-scale, c–d) total richness (NTOT/Δt) at the stage-scale, and e–f) total richness (NTOT) at the 5-Ma-scale. Spearman's rho and p-values of all variables indicate a statistically significant positive correlation between the number of taxa and the number of formations. Obvious outliers in the genus plots at the LVF-scale and the stage-scale are from the earliest Triassic (Stage: Induan; LVF: Lootsbergian) and from the Middle Permian (Stage: Capitanian; LVF: Gamkan I)(see text for discussion).

