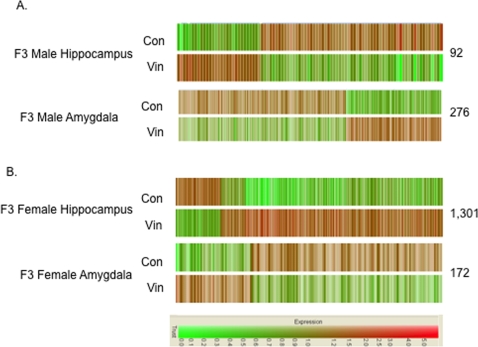
Figure 1. Brain transcriptome microarray analysis from F3 generation control (con) and vinclozolin (vin) animals.
(A) Dendrogram for male whole brain, male hippocampus and male amygdala for statistically significant regulated genes with signal above 75. (B) Dendrogram for female hippocampus or female amygdala for statistically significant regulated genes. The scale at the bottom margin indicates an increase (red) and decrease (green) in expression. The number of regulated genes is listed at the right of each gene set. The whole male brain was from 6 month old animals, and amygdala and hippocampus from 12–15 month old animals.

