TABLE III.
Clinical Data for Six Patients
| Evaluated feature | Patient’s number | |||||
|---|---|---|---|---|---|---|
| 1 | 2 | 3 | 4 | 5 | 6 | |
|
| ||||||
| Lesion cross-sectional image |
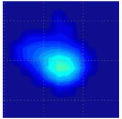
|
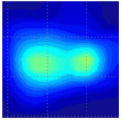
|
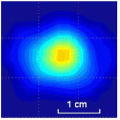
|
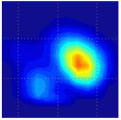
|
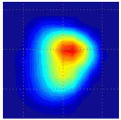
|
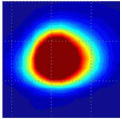
|
| Lesion dimensions, mm | 10 × 8 | 18 × 11 | 16 × 13 | 10 × 9 | 14 × 16 | 17 × 14 |
| Lesion cross-section area, mm2 | 78 | 180 | 170 | 74 | 206 | 171 |
| Lesion Young’s modulus, kPa | 50 | 25 | 108 | 75 | 68 | 123 |
| Lesion mobility, % | 21 | 19 | 7 | 17 | 12 | 8 |
| Lesion shape | Single peak | Mult. peak | Single peak | Mult. peak | Single peak | Single peak |
| Young’s modulus of bulk tissue, kPa | 6.7 | 7.0 | 5.7 | 5.6 | 6.9 | 9.5 |
| Heterogeneity of the bulk tissue, kPa | 0.30 | 0.05 | 0.71 | 0.44 | 0.41 | 0.56 |
| Lesion size measured by ultrasound, mm | 21 | 15 | 20 | 12 × 8 | 20 × 20 | 22 × 11 |
| Patient age, years | 74 | 17 | 19 | 60 | 62 | 52 |
| Biopsy | Benign fibrostic tissue | Benign nodular adenosis | Fibroadenoma | Adenocarcinoma | Ductal carcinoma | Ductal carcinoma |
