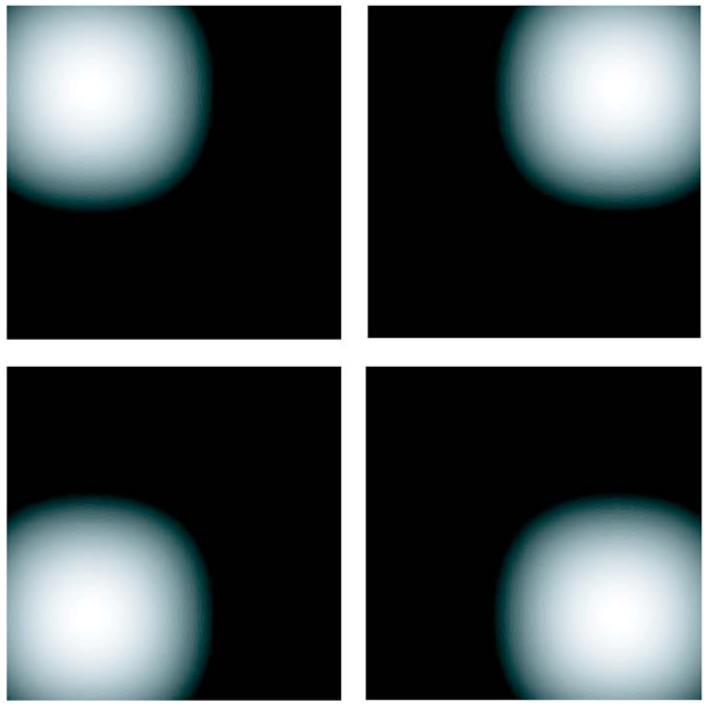
Fig. 3.

(Color online) Display of the response functions fm(τ) used in simulation of a Shack–Hartmann sensor with a single lenslet and a 2×2 array of photodetectors. Each plot represents the mean response of one photodetector as a function of the x and y components of the wavefront tilt.
