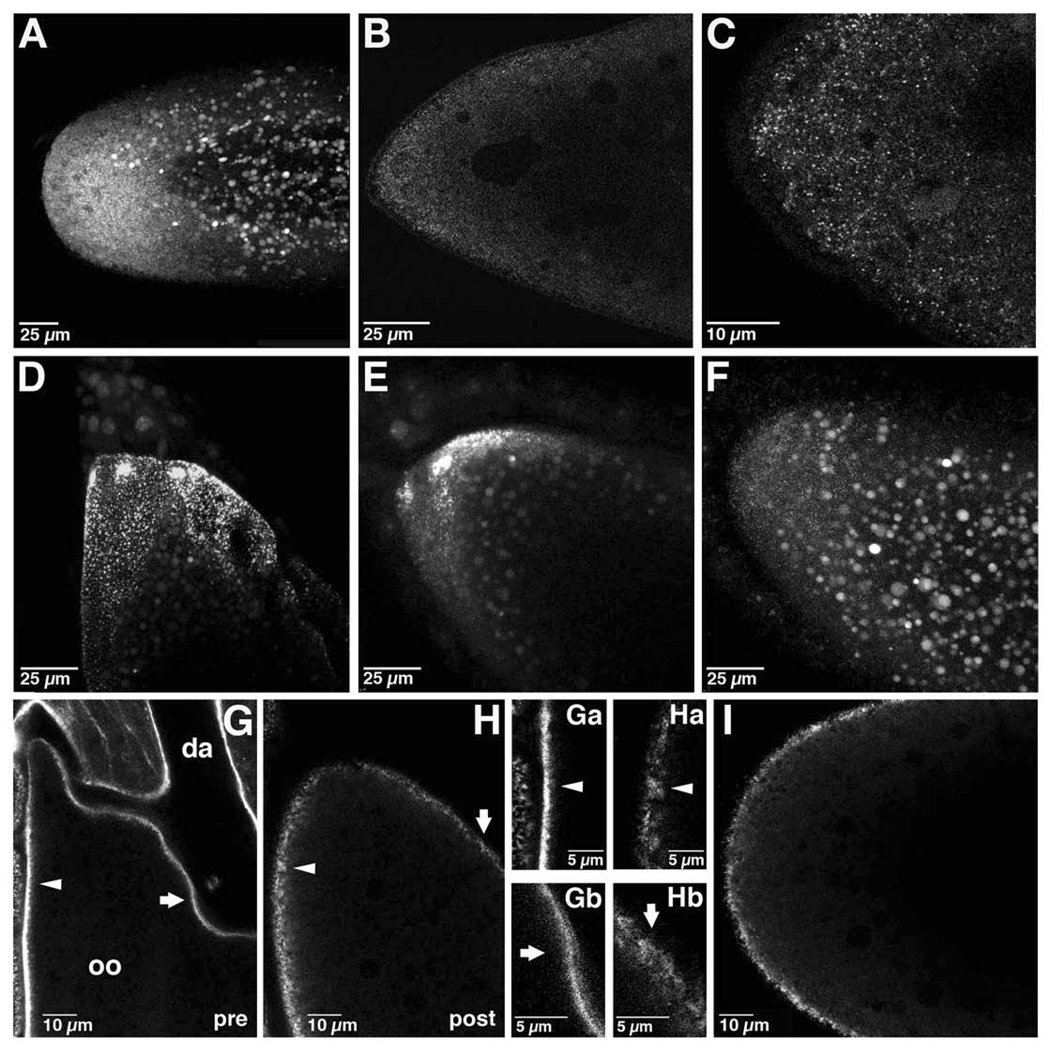
Figure 4. Redistribution of bcd and cortical actin during the transition from oogenesis to embryogenesis.
(A–C) Anterior region of early embryos expressing bcd*GFP. (A) Projection of approximately 52 µm through the anterior half of a newly fertilized embryo. (B) Single confocal section of the anterior region of an early embryo. (C) Confocal section from embryo in (B) taken at higher power. bcd mRNA is dispersed in small particles at the anterior in the early embryo. (D–F) In vitro activation of a stage 14 oocyte expressing bcd*GFP. Projections of confocal images taken (D) prior to addition of activation buffer, (E) 5 minutes after addition, and (F) 25 minutes after addition. bcd mRNA foci disperse into fine particles rapidly upon activation. (G–H) Single confocal sections of oocytes expressing GFP-moe. (G) Stage 14 oocyte, prior to in vitro activation (pre). GFP-moe also decorates the overlying follicle cells. Oo: oocyte; da: dorsal appendage. (H) The same oocyte, post-activation in vitro. The arrowhead and arrow indicate corresponding regions of the cortex pre- and post-activation.(Ga–Hb) Higher power images of the cortical actin cytoskeleton pre- (Ga, Gb) and post- (Ha, Hb) activation in the regions corresponding to the arrowheads and arrows in (G) and (H). (I) Confocal section of a newly fertilized embryo expressing GFP-moe.

