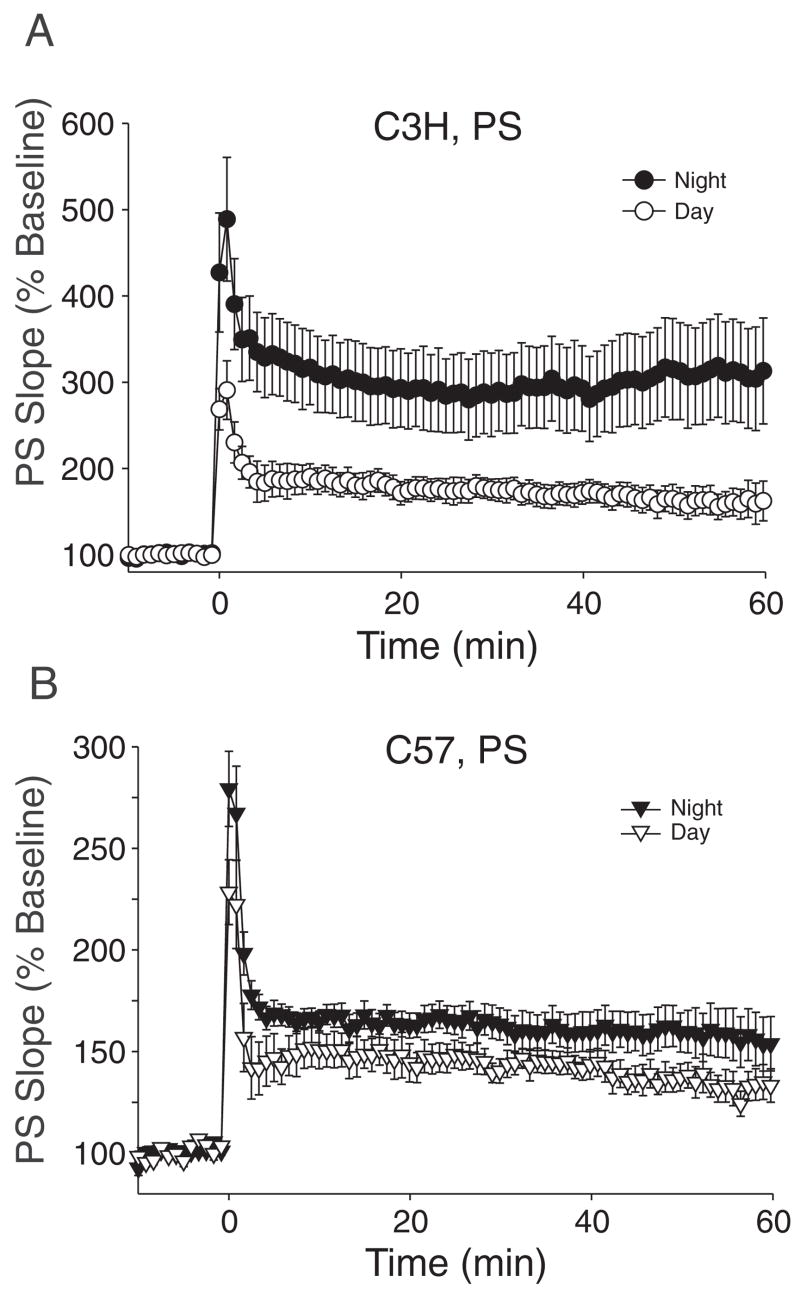
Figure 2.
Diurnal variation in long-term potentiation (LTP) measured in the cell body region of CA1 neurons in C3H and C57 mice. (A) Plots of population spike (PS) slope (normalized as a percentage of baseline) as a function of time measured in the day and night in C3H mice. (B) Plots of PS slope (normalized as a percentage of baseline) as a function of time measured in the day and night in C57 mice. The tetanus of 1 × 100-Hz stimulation was given at time = 0.

