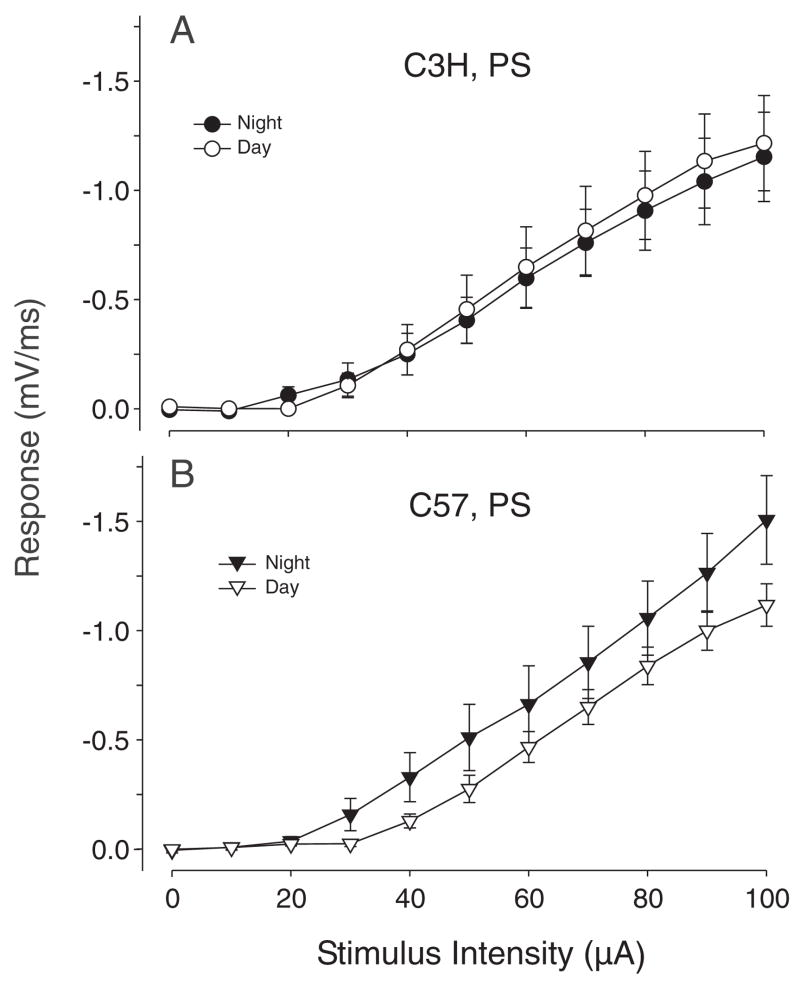
Figure 3.
Input/output (I/O) curves illustrating the relationship between the magnitudes of stimulation current and evoked response for the population spike (PS) recorded from C3H (A) and C57 (B) mice. The C3H mice did not exhibit a day/night difference in I/O curves measured for the PS (A). In contrast, the I/O curves for the PS recorded in the night from C57 mice were significantly larger then the I/O curves recorded in the day (B). The magnitude of the PS was larger in the night at each of the stimulus intensities between 30 and 100 μA. No diurnal differences were found in the I/O curves measured from the field excitatory postsynaptic potential (fEPSP) of C3H or C57 mice (data not shown).

