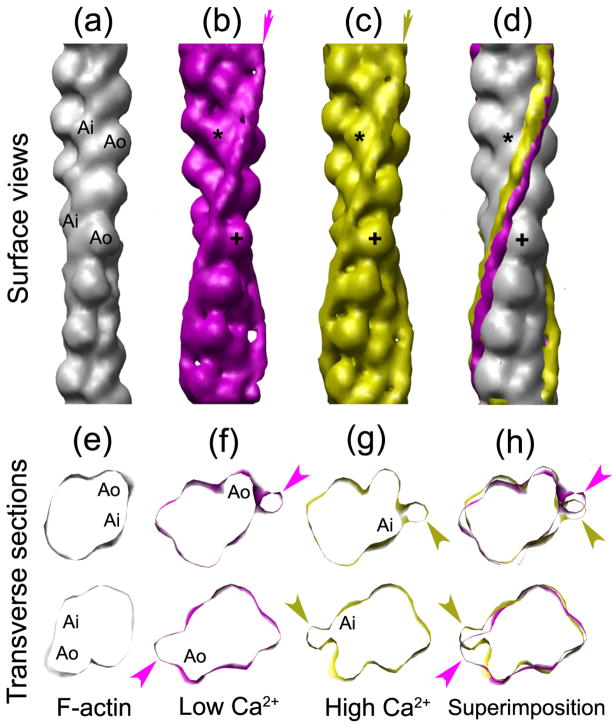
Figure 2. Three-dimensional reconstructions of thin filaments from Argopecten irradians.
(a–d) Surface views of: (a) atomic model of F-actin47 filtered to 2nm resolution; (b–c) reconstructions of thin filament at low Ca2+ (b), high Ca2+ (c); (d) (a)–c) superimposed. Arrows in (b) and (c) indicate the average positions of Tm in the reconstructions; the difference in their positions on the surface of actin (grey) is shown in (d). (e–h) Transverse sections at two axial levels of F-actin (e), and of thin filaments at low Ca2+ (f), high Ca2+ (g), and the two superimposed (h). In low Ca2+ (b, f), Tm is associated with the inner edge of the outer domain of actin (Ao; cross in b), while at high Ca2+ (c, g), Tm interacts with the inner domain (Ai; asterisk in c). Arrowheads in (f–h) indicate Tm density. The comparisons in (b–d) and (f–h) were made by manually aligning the actin backbones of the reconstructions (in longitudinal view) to the F-actin atomic model using Chimera.

