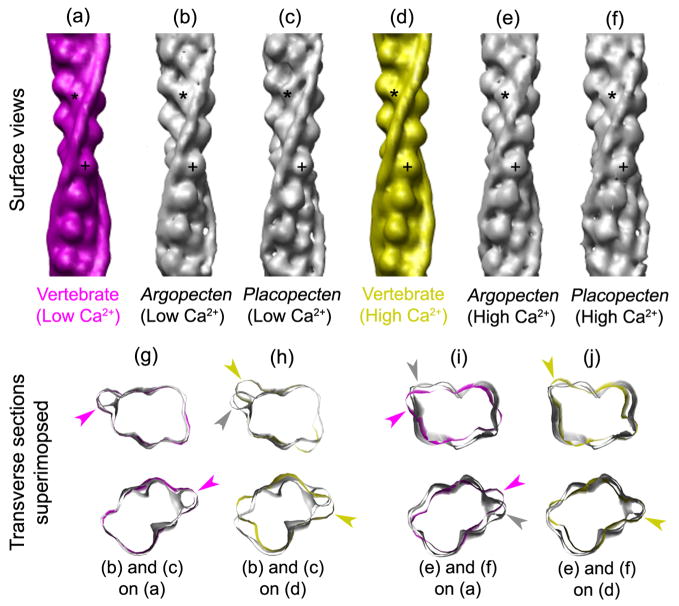
Figure 5. Comparison of low and high Ca2+ positions of Tm in scallop thin filament reconstructions with corresponding atomic models of vertebrate filaments.
(a, d) Surface views of vertebrate atomic models, low Ca2+ (magenta) and high Ca2+ (yellow), taken from29. (b, c and e, f) Surface views of low (b, c) and high (e, f) Ca2+ reconstructions from Argopecten and Placopecten, respectively. (g, h and i, j) Superposition of transverse sections from low (g, h) and high (i, j) Ca2+ thin filament reconstructions (grey) on low Ca2+ (g, i; magenta) and high Ca2+ (h, j; yellow) atomic models. Magenta and yellow arrowheads point to Tm positions of atomic models, and grey arrowheads to Tm positions in reconstructions. Tm density in the low Ca2+ reconstructions is indistinguishable from that in the low Ca2+ model (g), but distinct from that in the high Ca2+ model (h); Tm density in the high Ca2+ reconstructions is similar to that in the high Ca2+ model (j), but distinct from that in the low Ca2+ model (i).

